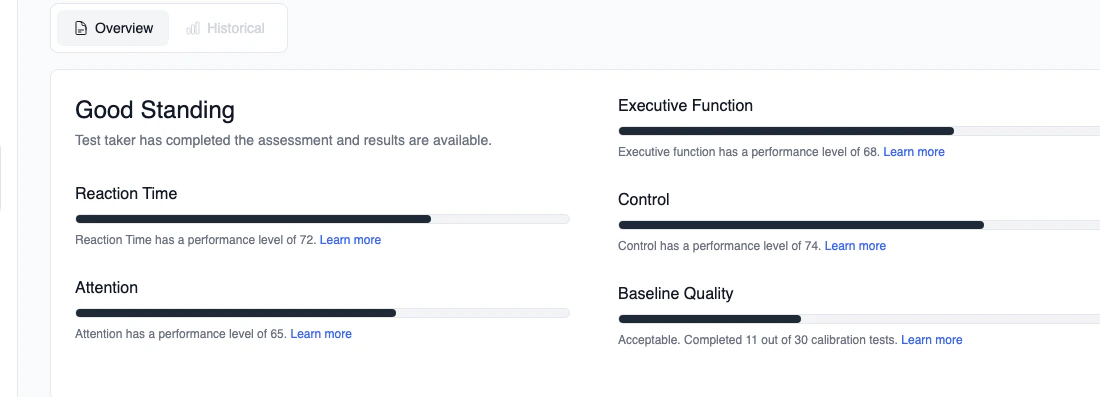
The Analysis page displays performance across four cognitive domains and a baseline quality indicator. Each domain reflects how a test taker performed relative to the general population. Cognitive Performance Overview A performance level of 1 in a cognitive domain indicates the test taker scored among the lowest performing from the general population, while a performance level of 99 indicates the best performing of the general population. A score of 50 represents typical performance. Performance levels are calculated relative to test takers with a similar level of practice, accounting for the natural effects of repeated testing.
Not all cognitive domains contribute equally to overall risk. Individual domain scores should not be used on their own to determine or override a test taker’s safety status — that is, their overall result of Completed or High Risk.Safety decisions are best informed by the test taker’s overall standing, which weighs all domains together. A strong score in one domain (such as Reaction Time) does not offset risk identified across the full assessment.
For guidance on how cognitive performance across these domains relates to observable behaviours in safety-sensitive work, see Cognitive Performance in the Workplace. If test takers are testing as part of a daily testing project, they will naturally improve their raw performance over time due to the effects of practice. Performance levels account for this by comparing each test taker against others with a similar number of prior tests, so a practiced test taker is measured against practiced peers rather than novices. Day-to-day changes in a test taker’s scores remain the most meaningful signal for detecting acute risk. The test taker’s overall safety status is still the single recommended metric for gauging safety-sensitive risk rather than individual cognitive domain scores at a point in time.

Reaction Time

Reaction Time measures the speed of response to stimuli, captured during Tasks 1 and 2 of the test. Faster and more consistent reaction times correspond to higher performance levels 1. High Reaction Time performance indicates quick, consistent responses.

Attention

Attention measures visual scanning speed and sustained focus, captured during Tasks 3 and 4 of the test. These tasks require the test taker to locate and connect numbered targets in sequence, measuring how quickly and accurately they can scan the display and maintain focus 2. High Attention performance indicates the test taker maintained consistent focus and efficient visual scanning.

Executive Function

Executive Function measures higher-order cognitive planning, flexibility, and working memory, captured during Tasks 5 and 6 of the test. These tasks require the test taker to connect targets in an alternating sequence (for example, switching between numbers and letters), testing their ability to switch between rules, hold information in working memory, and plan ahead 3. High Executive Function performance indicates strong cognitive flexibility, working memory, and planning ability.

Control

Control measures the ability to regulate physical responses during testing, captured across all six tasks of the test. It reflects how precisely the test taker interacts with the device, where smooth, deliberate movements correspond to higher performance levels than erratic or imprecise ones 4. High Control performance suggests the test taker was physically steady and deliberate.

Baseline Quality

Baseline Quality indicates how reliable the cognitive performance measurements are based on the number of prior tests for this individual. More tests provide a stronger baseline for comparison, making the results more meaningful. Baseline Quality is designed for daily testing environments where test takers complete tests on a regular basis. There are three calibration stages:
StageTests CompletedWhat It Means
CalibratingFewer than 10The system is still collecting data. Performance levels may shift as more tests are completed. Encourage the test taker to continue testing to establish an acceptable baseline.
Acceptable10 to 29Enough data exists for meaningful comparisons. Performance measurements are reasonably stable, though additional tests will continue to improve reliability.
Excellent30 or moreA robust baseline has been established. The test taker has completed enough tests for reliable performance measurements, suitable for confident decision-making.
The baseline count includes all tests completed by a test taker across any project in your workspace.

References

1. Sheppard, L. D., & Vernon, P. A. (2008). Intelligence and speed of information-processing: A review of 50 years of research. Personality and Individual Differences, 44(3), 535-551. doi:10.1016/j.paid.2007.09.015 2. Sanchez-Cubillo, I., Perianez, J. A., Adrover-Roig, D., Rodriguez-Sanchez, J. M., Rios-Lago, M., & Tirapu, J. (2009). Construct validity of the Trail Making Test: Role of task-switching, working memory, inhibition/interference control, and visuomotor abilities. Journal of the International Neuropsychological Society, 15(3), 438-450. doi:10.1017/S1355617709090626 3. Arbuthnott, K., & Frank, J. (2000). Trail Making Test, Part B as a measure of executive control: Validation using a set-switching paradigm. Journal of Clinical and Experimental Neuropsychology, 22(4), 518-528. doi:10.1076/1380-3395(200008)22:4;1-0;FT518 4. Memedi, M., Sadikov, A., Groznik, V., Zabkar, J., Mozina, M., Bergquist, F., Johansson, A., Haubenberger, D., & Nyholm, D. (2015). Automatic spiral analysis for objective assessment of motor symptoms in Parkinson’s disease. Sensors, 15(9), 23727-23744. doi:10.3390/s150923727