> ## Documentation Index
> Fetch the complete documentation index at: https://help.neurapulse.com/llms.txt
> Use this file to discover all available pages before exploring further.
# Project-Level Analysis
### Accessing the Project Dashboard[](#accessing-the-project-dashboard "Direct link to Accessing the Project Dashboard")
1. Open the project from the Projects list
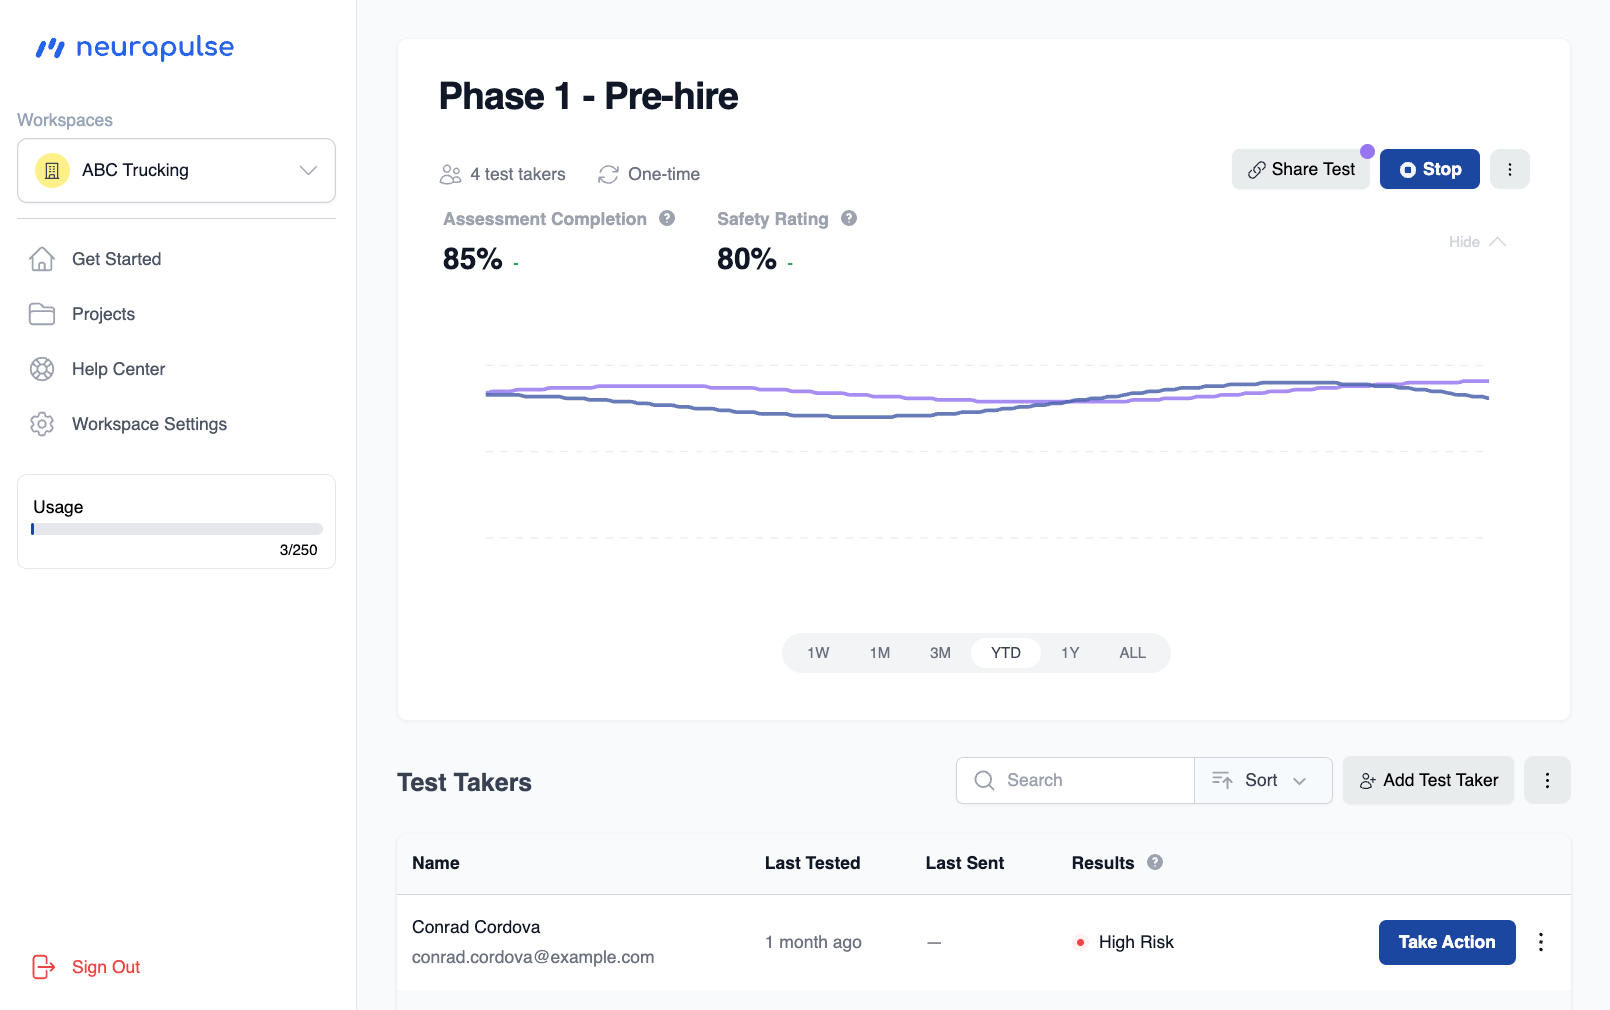
2. View the main chart for an overview of project metrics
 ### Key Metrics[](#key-metrics "Direct link to Key Metrics")
* Safety Rating - *The average percentage of completed assessments classified as safe over the selected period. The change shows how this average compares to the previous equivalent period.*
For a 7-day period: If the average Safety Rating for the past 7 days is 85%
and it was 80% for the 7 days before that, the change would be shown as "+5%
from previous week".
* Test Completion Rate - *The average percentage of started assessments that were completed over the selected period. The change indicates how this average compares to the previous equivalent period.*
For a 7-day period: If the average Assessment Completion rate for the past 7
days is 90% and it was 95% for the 7 days before that, the change would be
shown as "-5% from previous week".
### Analyzing Trends[](#analyzing-trends "Direct link to Analyzing Trends")
1. Click on the Hide/Show button on the chart to expand/collapse
2. Hover over data points for detailed information
### Key Metrics[](#key-metrics "Direct link to Key Metrics")
* Safety Rating - *The average percentage of completed assessments classified as safe over the selected period. The change shows how this average compares to the previous equivalent period.*
For a 7-day period: If the average Safety Rating for the past 7 days is 85%
and it was 80% for the 7 days before that, the change would be shown as "+5%
from previous week".
* Test Completion Rate - *The average percentage of started assessments that were completed over the selected period. The change indicates how this average compares to the previous equivalent period.*
For a 7-day period: If the average Assessment Completion rate for the past 7
days is 90% and it was 95% for the 7 days before that, the change would be
shown as "-5% from previous week".
### Analyzing Trends[](#analyzing-trends "Direct link to Analyzing Trends")
1. Click on the Hide/Show button on the chart to expand/collapse
2. Hover over data points for detailed information
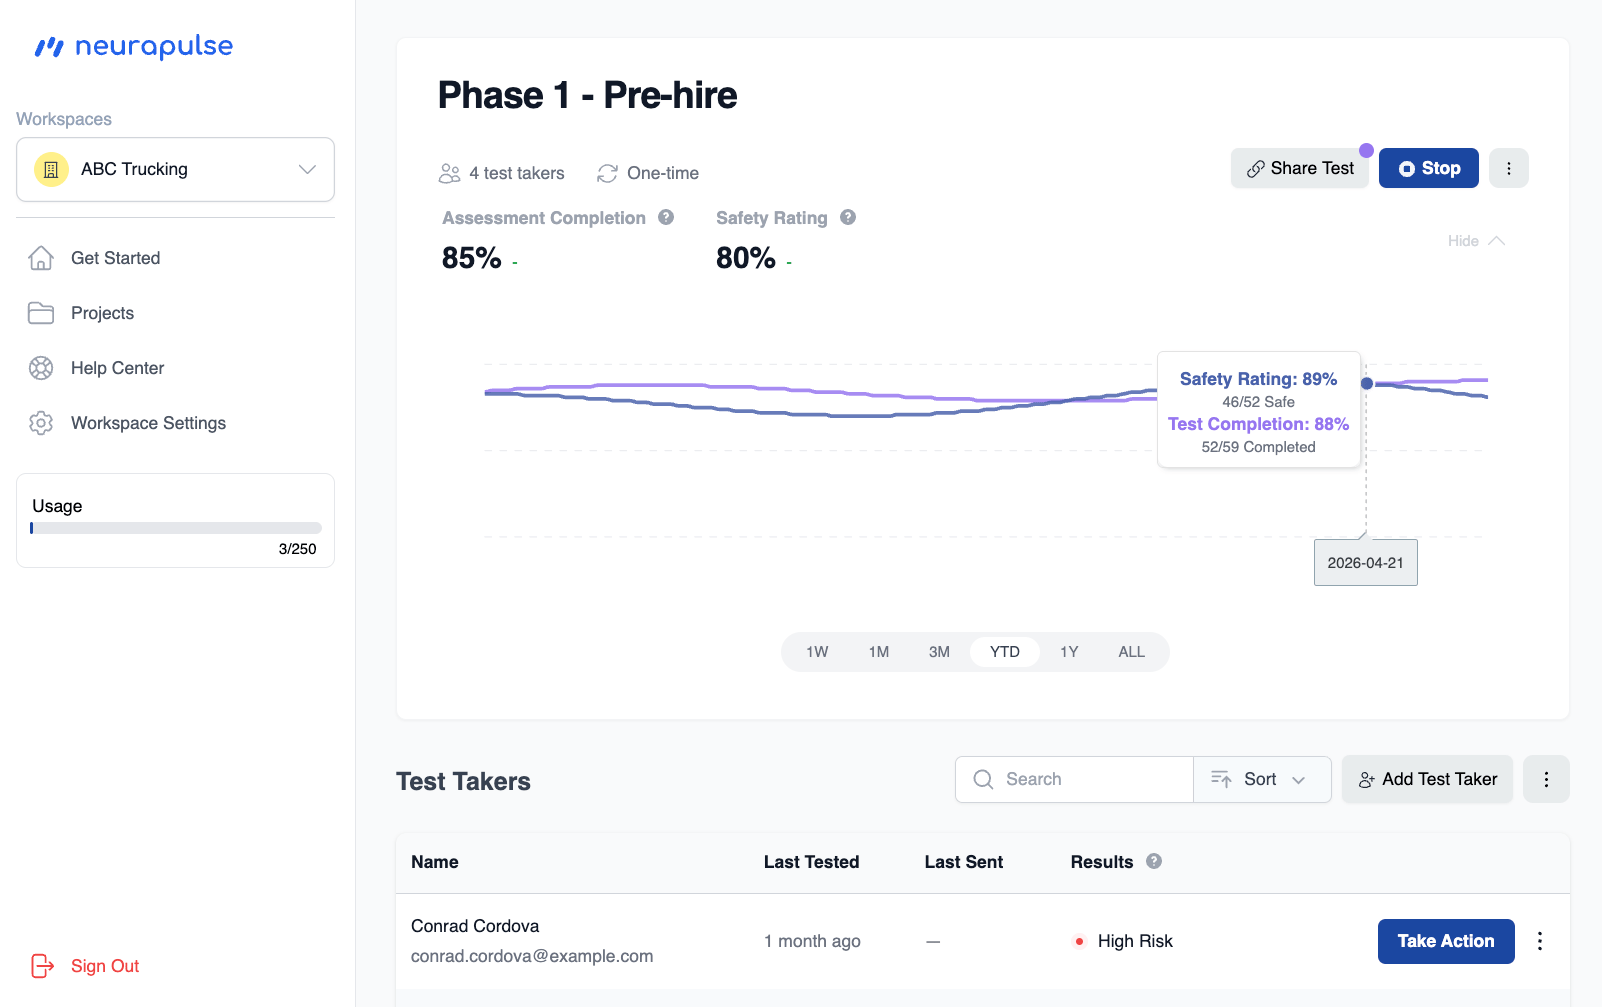 3. Monitor changes in safety ratings over time
4. Identify patterns or shifts in risk levels
### Using Data for Decision Making[](#using-data-for-decision-making "Direct link to Using Data for Decision Making")
* Implement targeted safety measures based on trends
* Increase testing frequency if needed
* Use insights to inform training programs or policy updates
Regularly review project-level data to identify long-term trends and optimize
your safety protocols. This is especially powerful with projects containing
many test takers.
3. Monitor changes in safety ratings over time
4. Identify patterns or shifts in risk levels
### Using Data for Decision Making[](#using-data-for-decision-making "Direct link to Using Data for Decision Making")
* Implement targeted safety measures based on trends
* Increase testing frequency if needed
* Use insights to inform training programs or policy updates
Regularly review project-level data to identify long-term trends and optimize
your safety protocols. This is especially powerful with projects containing
many test takers.