> ## Documentation Index
> Fetch the complete documentation index at: https://help.neurapulse.com/llms.txt
> Use this file to discover all available pages before exploring further.
# Analysis Page
The Analysis page provides a cognitive domain overview for an individual test taker. You can access it by clicking the Action button → Analysis on the right side of a test taker row in a project page.
 ### Overview
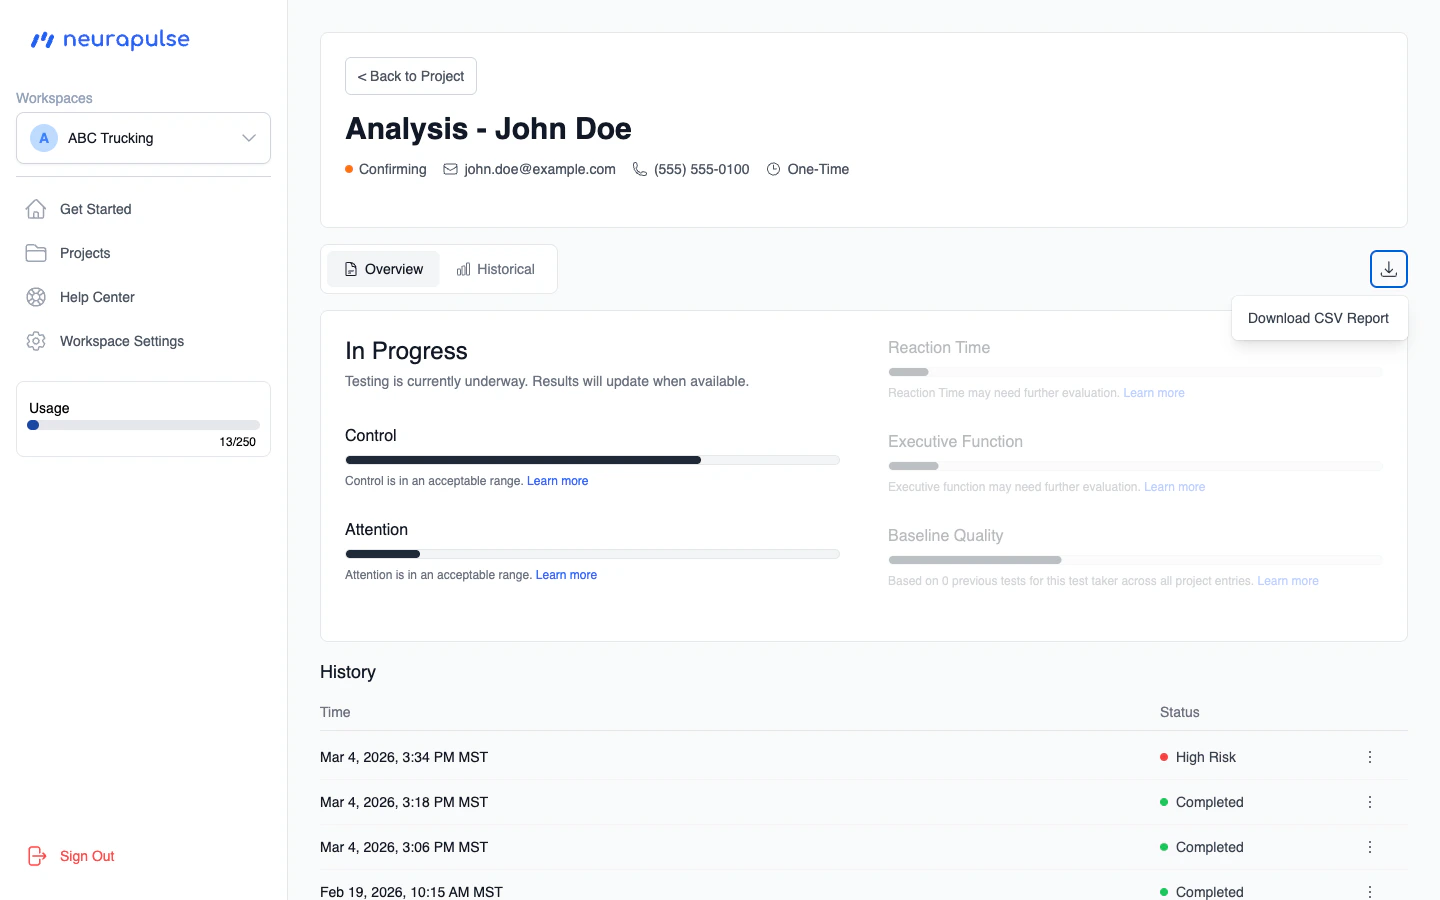
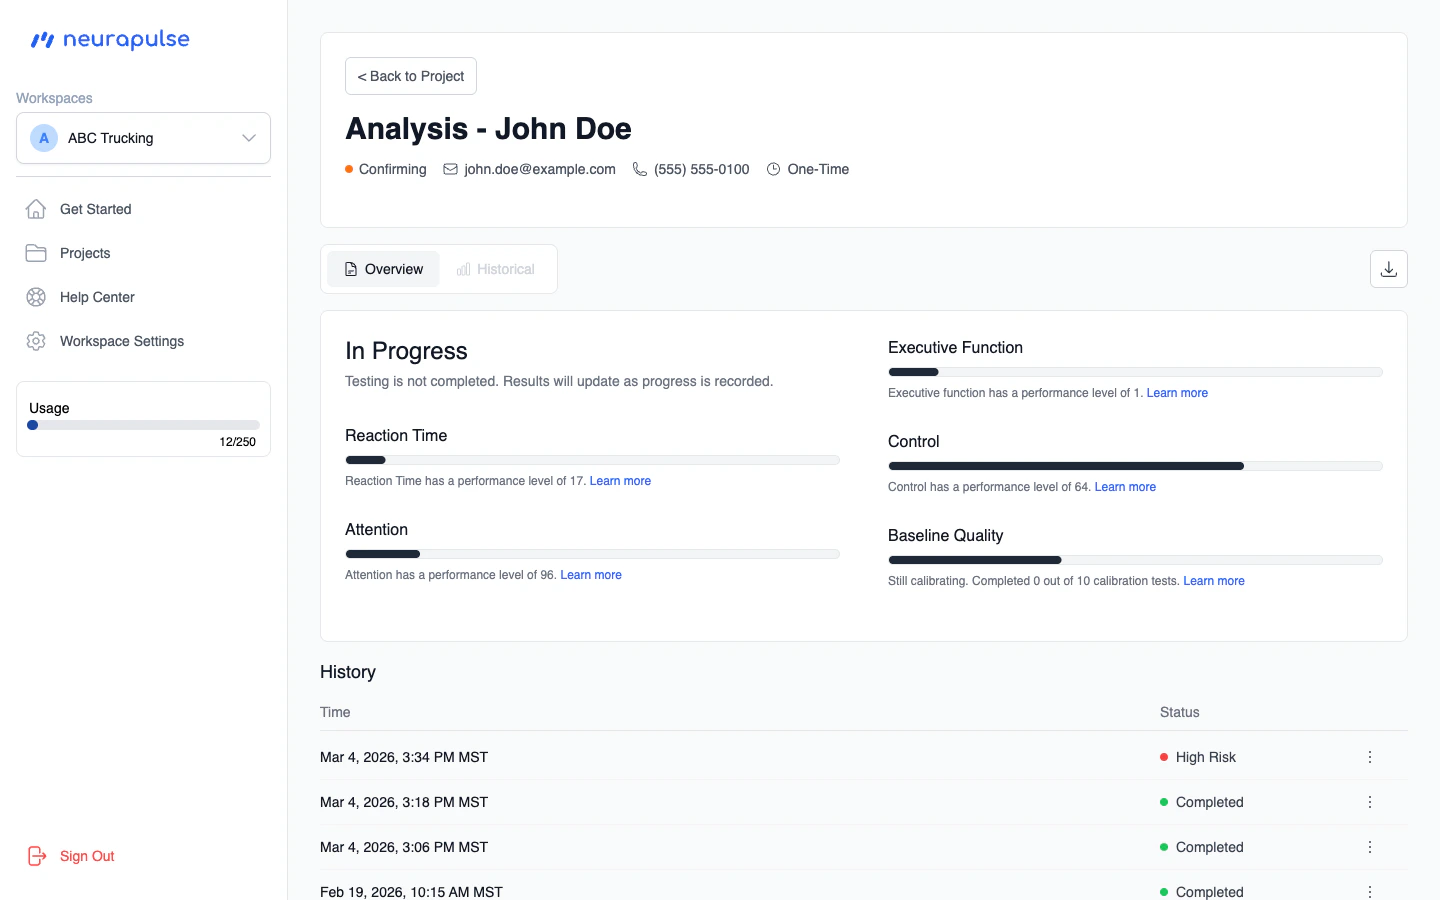
At the top, you'll see the test taker's name, current status, and contact information. Below that, a summary heading indicates their overall standing based on their cognitive scores — such as **Good Standing**, **Needs Review**, or **Attention Required**. If the test is still in progress, the heading will reflect the current status instead (e.g., "In Progress" or "Confirming").
Four cognitive domains are displayed as progress bars:
* **Control** — Ability to regulate physical responses
* **Attention** — The cognitive domain of sustained and directed focus
* **Reaction Time** — Speed of response to stimuli
* **Executive Function** — Higher-order cognitive planning and flexibility
Each bar shows the test taker's performance relative to the general driving population. Performance metrics that are not yet available appear dimmed. The **Baseline Quality** bar indicates how reliable the scores are based on the number of prior tests for this person. A half bar represents 10 prior tests, which is considered an acceptable baseline. A full bar represents 30 or more prior tests, which is an excellent baseline.
### Historical
Switch to the **Historical** tab to view trend charts for each cognitive domain over time.
### Overview
At the top, you'll see the test taker's name, current status, and contact information. Below that, a summary heading indicates their overall standing based on their cognitive scores — such as **Good Standing**, **Needs Review**, or **Attention Required**. If the test is still in progress, the heading will reflect the current status instead (e.g., "In Progress" or "Confirming").
Four cognitive domains are displayed as progress bars:
* **Control** — Ability to regulate physical responses
* **Attention** — The cognitive domain of sustained and directed focus
* **Reaction Time** — Speed of response to stimuli
* **Executive Function** — Higher-order cognitive planning and flexibility
Each bar shows the test taker's performance relative to the general driving population. Performance metrics that are not yet available appear dimmed. The **Baseline Quality** bar indicates how reliable the scores are based on the number of prior tests for this person. A half bar represents 10 prior tests, which is considered an acceptable baseline. A full bar represents 30 or more prior tests, which is an excellent baseline.
### Historical
Switch to the **Historical** tab to view trend charts for each cognitive domain over time.
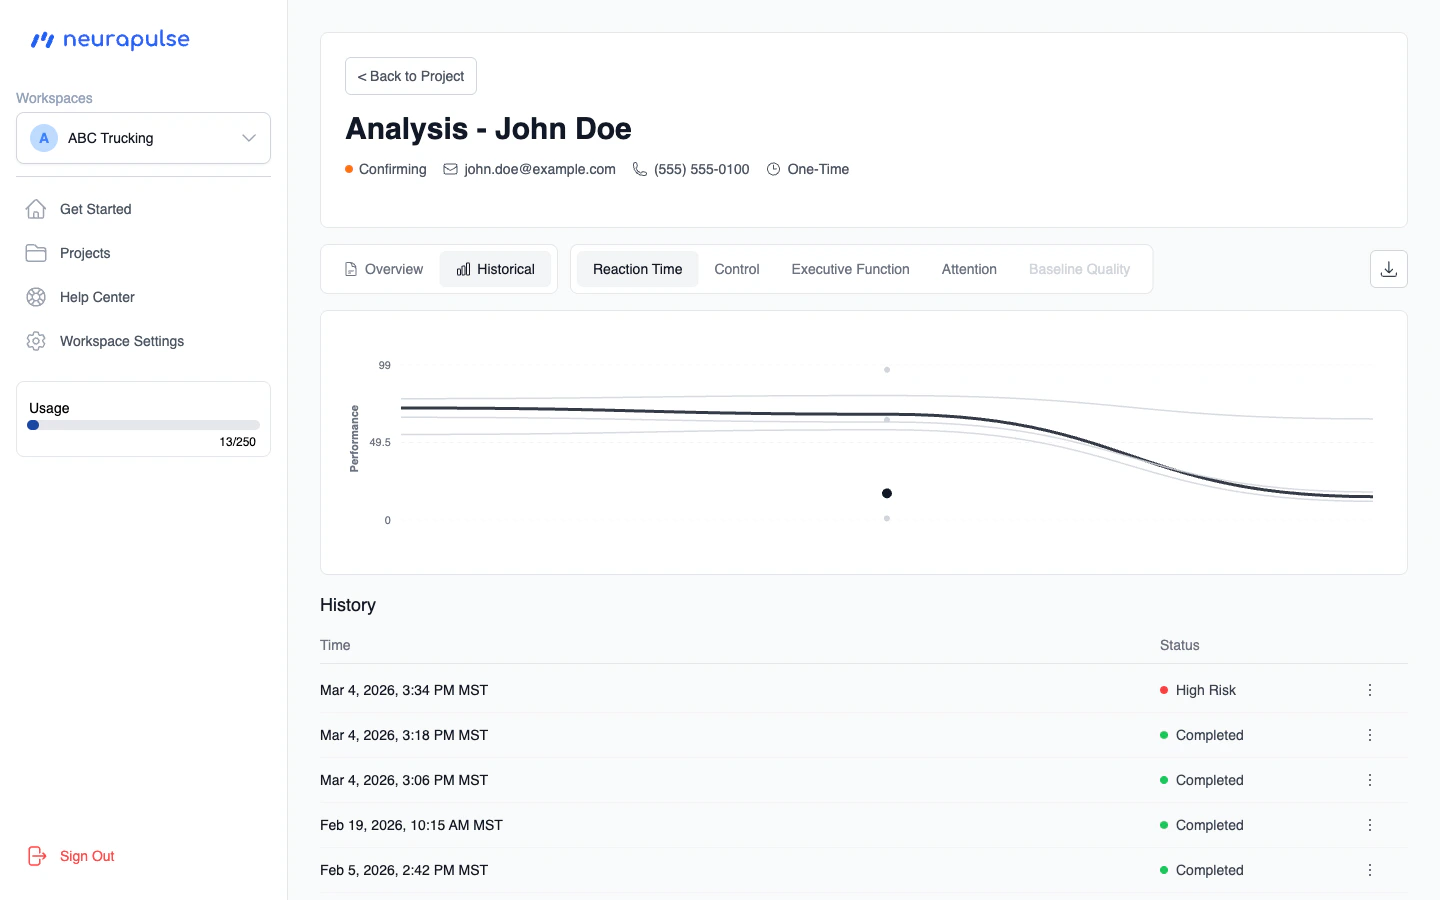 Use the filter buttons to toggle between domains. The charts plot percentile scores across all test attempts, making it easy to spot trends or sudden changes.
### History Table
Below the tabs, the history table lists all test attempts. Each row shows the date, status, and a link to the detail page for that attempt.
You can download a CSV report of all results using the download button in the top right.
Use the filter buttons to toggle between domains. The charts plot percentile scores across all test attempts, making it easy to spot trends or sudden changes.
### History Table
Below the tabs, the history table lists all test attempts. Each row shows the date, status, and a link to the detail page for that attempt.
You can download a CSV report of all results using the download button in the top right.